Quick answer
Personal injury lead volume follows crash volume, and crash volume is seasonal in a measurable way. Federal crash data shows fatal crashes running roughly 35% higher in the peak month than in the lowest month, with May through October carrying 53.6% of the year's fatal crashes and February sitting at the bottom. The six-month stretch from May to October is the sustained high season, which is why summer deserves the largest share of your budget. The counterintuitive part: the single highest month is October, not July. Plan spend against that curve, hold reserve for the January rebound, and stop reading a slow February as a marketing failure.
Most firms discover seasonality the wrong way. Leads drop in February, someone asks why the agency is failing, and three months of strategy gets rewritten in response to a pattern that repeats every single year.
This guide uses the federal crash census to show what the curve actually looks like, month by month, then maps it to budget, content, and intake decisions for 2027. Where the data contradicts the conventional wisdom, I have said so rather than smoothing it over.
Key Takeaways
- May through October carries 53.6% of the year. The summer half produces 15.5% more fatal crashes than the winter half, which is why summer earns the largest budget allocation.
- October, not July, is the single highest month. July is actually the weakest of the summer months. Most seasonality advice gets this backwards.
- The crash rate per mile driven peaks in September, at 1.20 per 100 million vehicle miles traveled, because risk per mile keeps climbing after travel volume starts falling.
- January and February are structurally slow, not broken. They are the two lowest months of the year. A Q1 dip is the calendar, not your marketing.
- Case mix shifts more than case volume. Summer skews to motorcycle, bicycle, pedestrian, and recreational claims. Winter skews to slip and fall and multi-vehicle weather wrecks, which are harder to prove and slower to settle.
- Holidays spike severity, not just volume. The National Safety Council projected 437 traffic deaths over the 2025 Independence Day period alone.
- Late December signs poorly even when volume is high. Inquiries arrive and prospects postpone decisions until January, which explains the January rebound.
What the Federal Crash Data Actually Shows
Fatal crashes peak in October and bottom out in February, with a sustained elevated stretch from May through October that accounts for slightly more than 53% of the year's total.
This is the part nearly every article on this topic skips: You can plan against the federal census of fatal crashes, broken out by month. NHTSA's Fatality Analysis Reporting System records every fatal motor vehicle crash in the 50 states, DC, and Puerto Rico.
Here is the 2024 monthly distribution, with an index where 100 equals the monthly average.
| Month | Fatal crashes | Index (100 = avg) | Read |
|---|---|---|---|
| January | 2,538 | 84 | Second lowest |
| February | 2,498 | 83 | Floor of the year |
| March | 2,893 | 96 | Recovery begins |
| April | 2,938 | 97 | Still below average |
| May | 3,178 | 105 | High season starts |
| June | 3,199 | 106 | Sustained |
| July | 3,092 | 102 | Dips below June |
| August | 3,342 | 110 | Second highest |
| September | 3,277 | 108 | Rate per mile peaks |
| October | 3,369 | 111 | Peak of the year |
| November | 3,077 | 102 | Holiday travel offsets decline |
| December | 2,896 | 96 | Volume falls, severity rises |
| Total | 36,297 |
The peak is in autumn, not midsummer. October is the highest month and August is second. July, which most seasonal marketing advice treats as the apex, ranks only sixth. Vacation travel raises exposure, but it also moves traffic off commuter routes and into lower-risk patterns on some days.
The winter floor is deep and predictable. February runs 17% below the monthly average. If your pipeline drops in February, you want to recognize the pattern, do not restructure the account.
Month-By-Month Breakdown for 2027
Treat March through April as ramp-up, May through October as peak with the largest allocation, November and December as high-severity and low-signing, and January and February as rebound and preparation.
| Month | Volume | What drives it | What your firm should be doing |
|---|---|---|---|
| January | Low (84) | Post-holiday delayed decisions, winter weather claims in cold states | Work the December backlog. Signing rates rebound despite low new crash volume. |
| February | Lowest (83) | Shortest month, lowest travel, lowest crash volume | Build. Publish spring and summer content now so it indexes before demand. Audit intake. |
| March | Below avg (96) | Spring break travel, daylight saving transition, warming weather | Turn paid spend up. Launch motorcycle and bicycle content before the season. |
| April | Below avg (97) | Rising vehicle miles, motorcycle season opens, rain | Full ramp. Distracted Driving Awareness Month is a genuine content hook. |
| May | High (105) | Memorial Day, school ends, the 100 Deadliest Days begin | Peak budget starts here, not in July. Motorcycle Safety Month content. |
| June | High (106) | Road trips, teen drivers, construction zones, pools | Hold peak spend. Watch intake capacity, not just lead volume. |
| July | Above avg (102) | Independence Day, peak vacation travel, alcohol-related incidents | Highest severity holiday of the year. Staff intake for the long weekend. |
| August | Second highest (110) | Back-to-school traffic, late-summer travel, construction | Do not cut spend here. August outperforms July. |
| September | High (108) | School traffic, shorter days, highest crash rate per mile | Sustain. The rate per mile peaks now. |
| October | Peak (111) | Darkness, rain, and leaves, plus Halloween pedestrian risk | Your single biggest month. Budget accordingly. |
| November | Above avg (102) | Thanksgiving travel, first freezes, early darkness | Slip and fall content goes live. Holiday travel campaigns. |
| December | Below avg (96) | Holiday travel and impaired driving. Volume down, severity up | Expect inquiries without signatures. Nurture, but do not panic. |
Why Summer Deserves the Largest Share of Your Personal Injury Budget
Most accidents do not happen during the traditional definition of summer (from Memorial Day through Labor Day), though that's when the annual increase in fatal accidents starts.
The longest sustained stretch of elevated volume, the period of maximum exposure for the most valuable case types, and the window where capacity rather than demand constrains case growth actually runs from August through October
The case for weighting summer heaviest rests on four things.
Duration, Not Peak
May through October produces 19,457 fatal crashes against 16,840 for November through April. One higher month matters far less than six consecutive months running above average. Budget should follow sustained demand.
Exposure for High-Value Case Types
Motorcycle, bicycle, and pedestrian claims concentrate in warm months, and they carry severe injuries and higher case values than the average rear-end collision. Recreational claims, pools, boats, ATVs, and premises claims at seasonal venues also cluster here.
The 100 Deadliest Days
AAA uses that label for the stretch from Memorial Day to Labor Day. Its analysis of NHTSA data found that crashes involving teen drivers killed 13,135 people from 2019 through 2023, with more than a third of those deaths falling inside that window.
Season by Season for Personal Injury Law Firms: What Changes in Your Case Mix
Volume varies by about a third across the year, but case mix changes far more, and case mix drives your content, your intake questions and your settlement timelines.
| Season | Volume | Dominant case types | Content priority | Operational note |
|---|---|---|---|---|
| Spring (Mar to May) | Rising | Motorcycle, bicycle, spring break travel, rain-related collisions | Motorcycle and cyclist content live by March | Build the spring content in January and February |
| Summer (Jun to Aug) | Peak sustained | Auto, motorcycle, pedestrian, pool and drowning, recreational, construction zone | Highest paid spend, broadest case-type coverage | Intake capacity is the limiting factor |
| Autumn (Sep to Nov) | Peak then declining | Auto at the rate-per-mile peak, pedestrian visibility, early weather wrecks, Halloween | Darkness and visibility content, Thanksgiving travel | October is your biggest month, so staff for it |
| Winter (Dec to Feb) | Lowest volume, highest severity per incident | Slip and fall on ice, multi-vehicle weather collisions, impaired driving | Slip and fall pages live by November | Expect a signing lag in late December |
The winter shift matters more than the volume drop. Slip and fall claims differ from auto claims: Insurance companies contest liability more often, notice and maintenance records drive the case, and evidence degrades within hours as ice melts. Firms that run the same intake script year-round lose winter cases they could have signed.
Falls are also larger than most firms assume. The National Safety Council, using NCHS data, reports that 43,020 people aged 65 and older died from preventable falls in 2024, and emergency departments treated more than 3.85 million persons in emergency departments for fall injuries in 2023. Fall deaths in that group increased 51% over the past decade.
Holidays for Personal Injury: Where Severity Concentrates
Holidays raise severity and impaired-driving incidence more than they raise total volume, and the signing behavior around them matters as much as the crash data.
| Holiday period | What happens | Firm action |
|---|---|---|
| Memorial Day | Opens the 100 Deadliest Days due to travel and alcohol | Start peak budget. Staff the long weekend |
| Independence Day | NSC projected 437 traffic deaths over the 2025 period and calls it consistently one of the deadliest stretches of the year | Highest intake staffing of the year |
| Labor Day | Closes the summer window. Travel plus alcohol | Sustain spend. Do not cut after August |
| Halloween | Pedestrian risk concentrated in evening hours, children present | Pedestrian and child injury content in October |
| Thanksgiving | Among the heaviest travel periods. NSC projected 518 deaths over the 2022 period | Long-weekend intake coverage. Expect a Monday surge |
| Christmas and New Year | High impaired driving, high severity, lowest signing rates of the year | Nurture sequence, not a hard close |
| Super Bowl Sunday | Concentrated single-evening impaired driving | One-day intake coverage |
Two notes on using these figures. NSC issues projections per holiday per year and the periods differ in length, so they do not directly compare to each other. And the most useful holiday insight is not the crash count at all. It is that December produces inquiries without signatures. People get hurt, call, then decide to deal with it after the holidays. The January rebound that follows is not new demand. It is deferred demand closing.
The Q1 Problem: Why January and February Feel Worse Than They Are
January and February are the two lowest crash months of the year, so a Q1 lead decline is the calendar rather than a performance failure.
This is one of the most common complaints among law firm marketers, and the federal data settles it. February runs 17% below the monthly average and January 16% below. A firm whose lead volume drops 15% to 20% in Q1 performs exactly as the market dictates.
What actually goes wrong in Q1 is the response. Three mistakes repeat:
Cutting Spend Into the Trough
Cost per click often softens in Q1 while competitors pull back. Reducing spend when acquisition costs the least, then raising it in May when everyone bids, inverts the correct move.
Changing Strategy on One Quarter of Data
Marketers misread seasonal variation as channel failure. Judge channels on year-over-year comparisons for the same month, never month-over-month across a seasonal boundary.
The honest Q1 framing for a partner meeting: Compare January 2027 to January 2026, not to October 2026. If the year-over-year number increases, the program is working.
How to Build a Seasonal Timing Guide for Your Firm: 7 Essential Steps
Overlay your own three-year lead and signed-case data on the national curve, find where your market deviates, then build budget, content, and staffing calendars from your own numbers.
The national curve is the starting point, not the answer. Your market deviates from it in ways that matter.
Step 1: Pull three years of your own monthly data: leads, consultations, signed cases, and cost per signed case, by month. Three years smooths out one-off anomalies.
Step 2: Index your own months. Divide each month by your monthly average and multiply by 100, exactly as in the table above. Now you can compare your curve to the national one.
Step 3: Find your deviations. Snow Belt markets have a much deeper January trough and a far larger slip and fall share. Sun Belt markets have a flatter curve with winter tourism bumps. Markets with heavy commercial trucking corridors peak with freight cycles rather than vacation travel.
Step 4: Build the content calendar backwards. Publish three to four months ahead of demand. Motorcycle content in February, summer travel content in April, slip and fall content in September, holiday travel content in October. This is the single highest-return schedule in seasonal legal marketing, and it is almost entirely a question of discipline rather than budget. It applies to SEO for lawyers and to AI search visibility equally, since both reward content that has had time to establish authority.
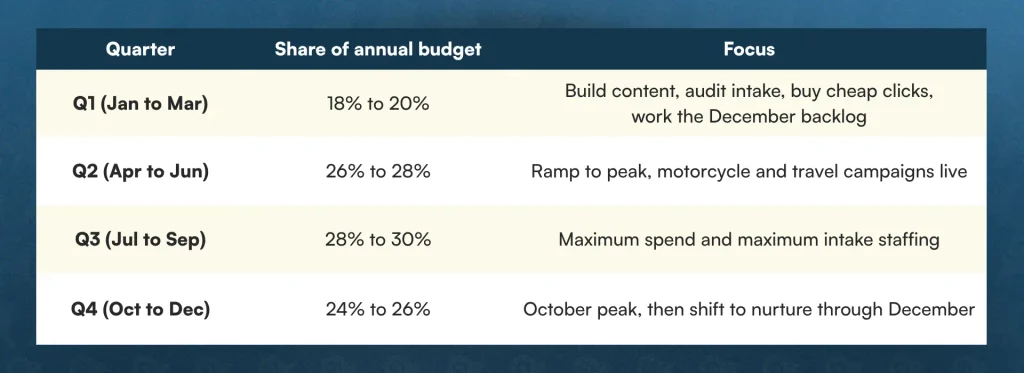
Step 5: Set budget by quarter, not by year. Allocate against your own curve, and remember that paid search is the only line you can move inside a month. Build the base with organic, then use Google Ads as the throttle to hit the quarterly number.
Step 6: Keep reviews flowing year-round. Review recency carries weight in local ranking and in the AI review summaries prospects now read, so a firm that collects reviews only in slow months looks stale during peak season. Our guide to Google reviews for lawyers covers the request system, and local SEO covers the rest of the map pack work that peak season rewards.
Step 7: Review in November for the following year. Which is to say, now.
Seasonality Mistakes to Avoid
- Flat monthly budgets. A 35% swing in demand should not meet a flat spend curve.
- Publishing content in the season it targets. Too late. Lead by a quarter.
- Cutting spend in Q1 and raising it in Q3. The opposite of what the auction rewards.
- Treating summer as July. August and October both beat July. The season is May through October.
- Running one intake script all year. A winter slip and fall caller needs different questions than a June rear-end collision caller, starting with photographs before the ice melts.
- Panicking in late December. Low signing rates in the last two weeks of December are normal. The cases arrive in January.
- Comparing month over month across a seasonal boundary. Always compare the same month year over year.
- Buying more leads instead of fixing conversion. In peak season a firm converting 7% of leads needs roughly twice the spend of one converting 14%. Cost per signed case matters more than cost per lead. We break down the real figures in our analysis of personal injury lead costs.
- Ignoring Quality Score before blaming the market. Ad relevance and landing page experience move legal CPCs substantially, and peak season punishes a weak account hardest. See Google Ads Quality Score for law firms.
Ready to own the 2027 curve?
Hire Rankings.io to Generate More Personal Injury Leads in 2027
From Google to ChatGPT, show up everywhere injured people search. We build your content in the slow months, so you are already ranking when the May to October peak arrives.
| SEO for lawyers | AI search visibility | Google Ads |
|---|---|---|
| Organic and map pack rankings that bring in the lowest cost per signed case | Get cited in ChatGPT, Google AI Overviews, Perplexity, and Gemini answers | Paid search you can turn up or down each month to match the season |
Plan in November. Build in Q1. Win the peak.
Frequently Asked Question About Seasonality in Personal Injury Leads
What is the busiest season for personal injury leads?
The six-month stretch from May through October, which carries 53.6% of the year's fatal crashes. Within that window, the most fatal crashes take place in October (3,369 fatal crashes in 2024) and August (3,342). February has the lowest at 2,498, making the peak-to-trough spread roughly 35%. Most firms assume July is the apex, but July ranks only sixth. The practical takeaway is to weight budget across the whole May to October stretch rather than toward a single summer month.
Why do personal injury leads decline in the first quarter?
Because January and February are the two lowest crash months of the year. February runs about 17% below the monthly average and January about 16% below, driven by less travel, fewer daylight hours of recreational activity, and the absence of the motorcycle, bicycle, and pedestrian exposure that fills warm months. A Q1 decline of 15% to 20% is the normal seasonal pattern, not a marketing failure. Compare January year over year rather than against the previous October.
How do you generate personal injury leads?
Through a mix of organic search, paid search, Local Services Ads, referrals, and reviews, weighted to the season. Organic search and local SEO deliver the lowest long-run cost per case but need a three to four month lead time, so build content in Q1 for the Q2 and Q3 peak. Paid search and LSAs capture immediate demand and you can adjust those levers monthly. Reviews and reputation convert the traffic the other channels produce.
Does case type change by season?
Yes, and more than volume does. Summer skews toward motorcycle, bicycle, pedestrian, pool, and recreational claims, which tend to carry severe injuries and higher case values. Autumn adds pedestrian visibility collisions and early weather wrecks. Winter shifts toward slip and fall on ice and multi-vehicle weather collisions, which insurance companies contest more often liability and settle more slowly. Your intake script, your content calendar, and your expected settlement timelines should all shift with the mix.
What is the hardest injury to prove in a personal injury case?
Soft tissue injuries, mild traumatic brain injuries, and chronic pain conditions, because they often do not appear on imaging. Insurers dispute them by pointing to the absence of objective findings, gaps in treatment, or pre-existing conditions. Plan for this seasonal dimension: Winter slip and fall claims combine a hard-to-prove injury with contested liability and evidence that literally melts, so firms that want those cases need intake instructions about immediate photographs, incident reports, and witness details.
When should law firms plan their next year's marketing budget?
October or November, so the plan starts running before the Q1 content build. That timing lets you index the current year against fresh national data, publish spring and summer content during the January and February trough when you have capacity to produce it, and lock intake staffing for the May through October peak before you need it. Firms that budget in January have already lost the quarter that funds the peak.